Signal Without Substance: The Coarse-Grained Coverage Maps Concealing Rural Britain's Connectivity Divide
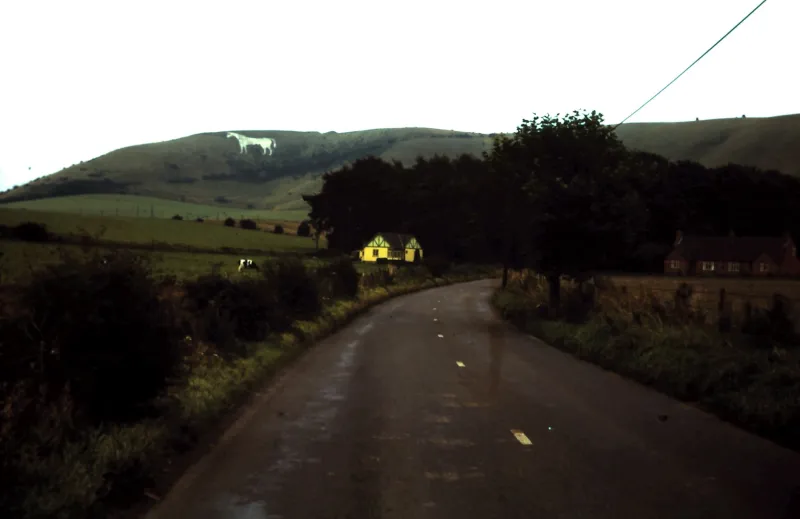
There is a particular frustration familiar to anyone who has tried to make a phone call from a hillside farm in Cumbria, a stone-built hamlet in mid-Wales, or a dispersed settlement on the Lincolnshire fens. The Ofcom coverage checker, consulted before the journey, indicated that the area was served by at least two major networks. The reality, encountered in the field, is four bars of signal on a clear hilltop that collapses to nothing the moment one steps inside a building, descends into a valley, or moves fifty metres in any direction.
This is not an anecdotal quirk. It is a systematic consequence of how Britain's authoritative mobile coverage data is produced, aggregated, and used — and it has material implications not only for individual connectivity but for the rural policy framework that depends on coverage maps as its primary evidence base.
How Coverage Maps Are Made — and Where They Break Down
Ofcom's Connected Nations report, published annually, is the definitive account of mobile coverage across the United Kingdom. The methodology underpinning it relies on signal propagation models submitted by the four major mobile network operators — EE, Vodafone, Virgin Media O2, and Three — which predict coverage based on transmitter locations, power outputs, antenna configurations, and terrain data.
The fundamental limitation of this approach is that it models outdoor coverage at a height of 1.5 metres above ground level, under median propagation conditions, against a terrain model that — while informed by Ordnance Survey elevation data — does not account for the micro-topographic features that most profoundly affect signal in rural environments. Dry-stone walls, dense woodland, river valleys, and the thick rubble-stone construction typical of traditional rural buildings all attenuate signal in ways that propagation models do not reliably capture.
The geographic unit of analysis compounds the problem. Coverage is assessed and reported at the 100-metre grid square level — a resolution appropriate for understanding regional patterns but wholly inadequate for characterising connectivity in dispersed settlements where individual properties may be separated by several hundred metres, each experiencing materially different signal conditions depending on local topography and building orientation.
The Aggregation Illusion
Consider a typical upland hamlet in the Yorkshire Dales: eight farmsteads scattered across a square kilometre of limestone moorland, connected by a network of unsurfaced lanes. Ofcom's methodology might classify the majority of that square kilometre as covered by two or more networks based on the predicted outdoor signal strength at representative grid points. The hamlet therefore appears in national statistics as a served settlement.
In practice, the two farmsteads in a sheltered gill will have no usable outdoor signal. Three more will receive intermittent signal that is insufficient for data services. The remaining three, positioned on exposed ground with line-of-sight to a distant mast, may have adequate voice coverage but unreliable data. None of the eight properties will have meaningful indoor coverage, because the propagation model does not account for signal attenuation through traditional stone construction.
Multiply this scenario across the tens of thousands of dispersed rural settlements in England, Scotland, and Wales, and the scale of the misrepresentation becomes apparent. The Countryside Alliance estimates that up to 1.5 million rural premises in the UK experience connectivity conditions materially worse than official coverage data suggests. The Campaign to Protect Rural England has documented numerous instances of communities denied Shared Rural Network investment on the basis that they are already classified as covered.
The Policy Consequences of Bad Geodata
The stakes of this mapping inaccuracy extend well beyond the inconvenience of a dropped call. Mobile connectivity in rural Britain is increasingly critical infrastructure: for precision agriculture systems that rely on real-time sensor data transmission, for farm management software that requires consistent cloud connectivity, for the telemedicine and remote working services on which dispersed communities depend, and for the emergency response networks that operate in areas where fixed-line alternatives are absent.
The Shared Rural Network programme — the government's flagship initiative to extend mobile coverage to the 4G notspots that official maps acknowledge — was designed to target genuinely unserved areas. But its geographic targeting relies on the same Ofcom coverage data whose limitations are the subject of this analysis. Areas that are de facto unserved but de jure covered are structurally excluded from the programme's scope, regardless of the lived experience of their residents.
This creates a circular policy problem. Coverage maps show rural Britain as better served than it is. Investment programmes target the residual gaps identified by those maps. The communities misclassified as covered receive no investment. Their misclassification persists in subsequent coverage assessments. The gap between map and reality widens with each reporting cycle.
What Hyperlocal Mapping Would Require
Addressing this problem requires a fundamentally different approach to coverage geography — one that begins with the settlement pattern rather than the signal model.
Britain's rural settlement geography is complex and historically layered. The Ordnance Survey's Address Base dataset contains property-level records for the overwhelming majority of occupied dwellings, including the isolated farmsteads and small hamlets that current coverage methodologies handle least well. A coverage assessment methodology that began with individual address points — rather than uniform grid squares — and modelled signal conditions at each point, accounting for building type, local terrain, and indoor attenuation, would produce a substantially more accurate picture of rural connectivity.
The technical capacity to do this exists. High-resolution LiDAR terrain models, building height and construction data from the Ordnance Survey's building height attribute layer, and the address-level precision of the National Address Gazetteer collectively provide the inputs necessary for property-level coverage modelling. Several academic institutions — including teams at the University of Edinburgh and University College London — have demonstrated proof-of-concept methodologies along these lines.
The barrier is not technical capability but institutional inertia. Ofcom's methodology was designed to balance statistical rigour with operational tractability across a national dataset. Moving to property-level modelling would require substantially greater computational resource, closer cooperation with network operators on transmitter data, and — critically — a willingness to acknowledge that the current methodology has systematically overstated rural coverage for the better part of a decade.
The Rural Landscape Deserves Accurate Geography
There is an irony in the fact that Britain's rural landscape — the subject of centuries of careful cartographic attention, from the earliest Ordnance Survey triangulation surveys to modern LiDAR campaigns — is so poorly served by the geographic data governing its digital connectivity.
The villages, farms, and hamlets that constitute rural Britain are not cartographic abstractions. They are communities with legitimate claims on the infrastructure investment that connectivity policy is designed to direct. When the maps that guide that investment misrepresent their situation, the consequences are not merely technical. They are a form of geographic injustice: the systematic disadvantaging of communities whose complexity the data cannot be bothered to resolve.
Accurate, hyperlocal coverage mapping is not a luxury. For rural Britain, it is a prerequisite for policy that actually works.